


Quick answer
Insurancy surveyed 2,400 US respondents about their online research and purchasing habits to build this e-commerce study. It covers how shoppers use reviews and search before buying, how mobile devices change behavior, and what ultimately drives an online purchase decision.
Understanding how customers engage with the buying process is an essential component for any business. As online shopping shifts from desktop platforms to mobile devices, consumer interactions with their favorite brands are ripe for change. Understanding consumers’ online browsing habits as they research and purchase products and what devices they use to take those actions can provide key insights into the digital infrastructure a business needs to support customer demand properly. For our study, we asked nearly 2,400 U.S. respondents about their online research and purchasing habits to understand the modern approach to online shopping better.
Summary of the Buyer Behavior Survey
Key Statistics from online research preferences questions
- 4 out of 10 people use a smartphone when conducting research online.
- Only 2.3% of those surveyed said they would use a smart speaker to help with online research.
- Smartphones are the most commonly used device for conducting online research.
- Individuals use more than one device when conducting research online.
- Laptops are the most preferred research tool for consumers over 55.
- Tablets are utilized nearly twice as often among consumers over 55 (23%) compared to those 54 and under (12%).
- Only 18% of respondents, 18-44 said they use desktop computers to conduct online research.
- 82% of consumers said they used Amazon or Google when researching a product.
- Only 8.2% of consumers use social media when researching a product online.
Key Statistics from online purchasing questions
- 71% of consumers prefer to use credit or debit cards when making online purchases.
- Only 2.5% of consumers prefer to use ACH as a form of online payment.
- Consumers prefer to utilize Paypal or Stripe (21%) nearly five times more than Apple Pay (4%) or Amazon Pay (4%)
- 40% of consumers aged 18-24 prefer to use debit cards, compared with 18% of consumers 65 and older.
- Generation Z prefers debit cards over credit cards as their most preferred method of payment online.
- Smartphones are the device most often used when making online purchases.
- 75% of online purchases are made with portable devices, like smartphones, tablets, and laptops.
- For consumers 65+, laptops are the preferred device for online transactions.
- 4 in 10 respondents say security is their biggest reason for using a particular payment method to purchase products online.
Buyer Behavior Survey Questions:
Jump to the answer to a specific question by clicking a question below: Online Research and Device Preferences 1. What device do you use to conduct online research? 2. Where do you search when researching a product? Online Purchasing Preferences 3. When purchasing a product online, what payment method do you most prefer? 4. When making online purchases, what device do you most often use? 5. When purchasing a product online, what is the biggest reason for using a particular payment method?
1. What device do you use to conduct online research?
Key Statistics:
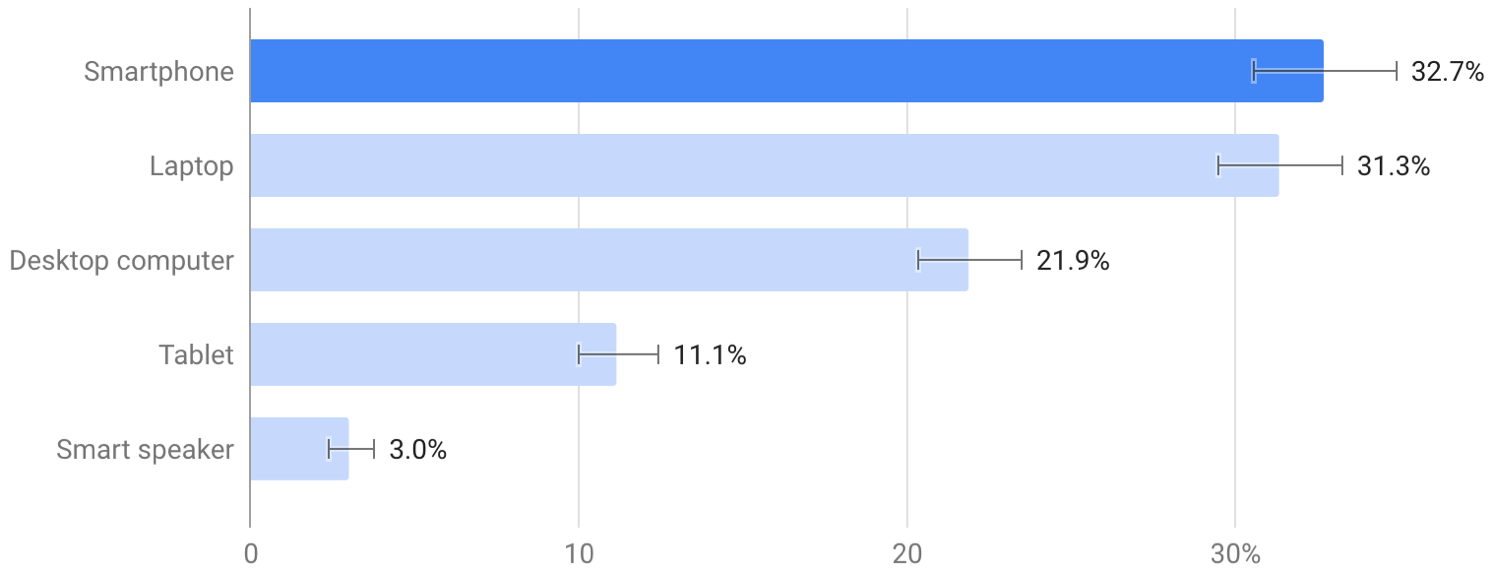
- 4 out of 10 people use a smartphone when conducting research online.
- Only 2.3% of those surveyed said they would use a smart speaker to help with online research.
- Smartphones are the most commonly used device for conducting online research.
- Individuals use more than one device when conducting research online.
- Smartphones, laptops, and tablets comprise 89.6% of online research.
- Stationary desktop devices comprise 22% of consumer online research.
This question was set up in a multiple-answer format, meaning that respondents could select more than one answer for their response. Because of this, the total number of responses was 31.5% above the number of total participants. Bearing that in mind, the numbers skew heavily toward mobility as a key factor when choosing a device to conduct online research. Mobility often comes at the sacrifice of screen size, something any business operating in the digital space should consider. Given that search engines like Google have started to prioritize how websites look on mobile devices over desktop versions, it’s safe to say that businesses operating in the digital space should invest in responsive design and web elements that look good on a wide assortment of screens.
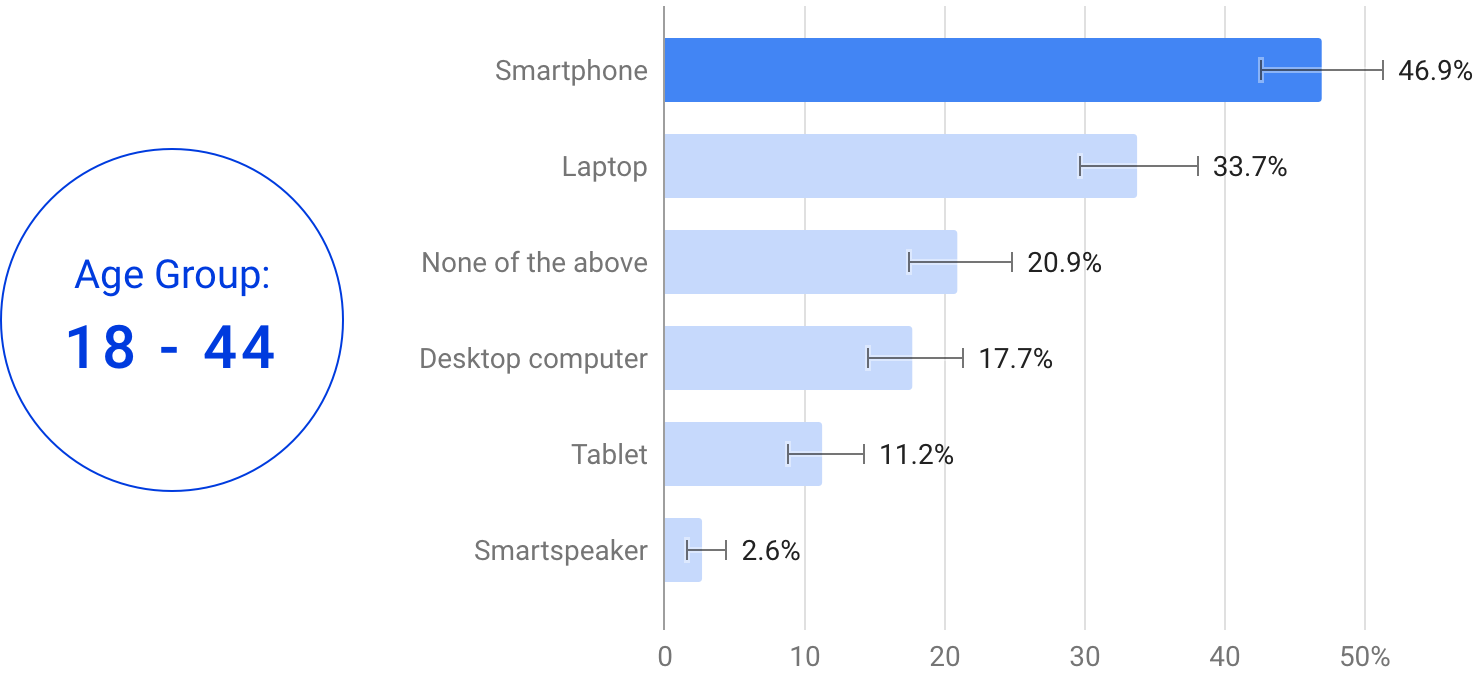
Age demographic results for 18 - 44-year-olds
- Almost 50% of those aged 18 -44 conduct online research using a smartphone.
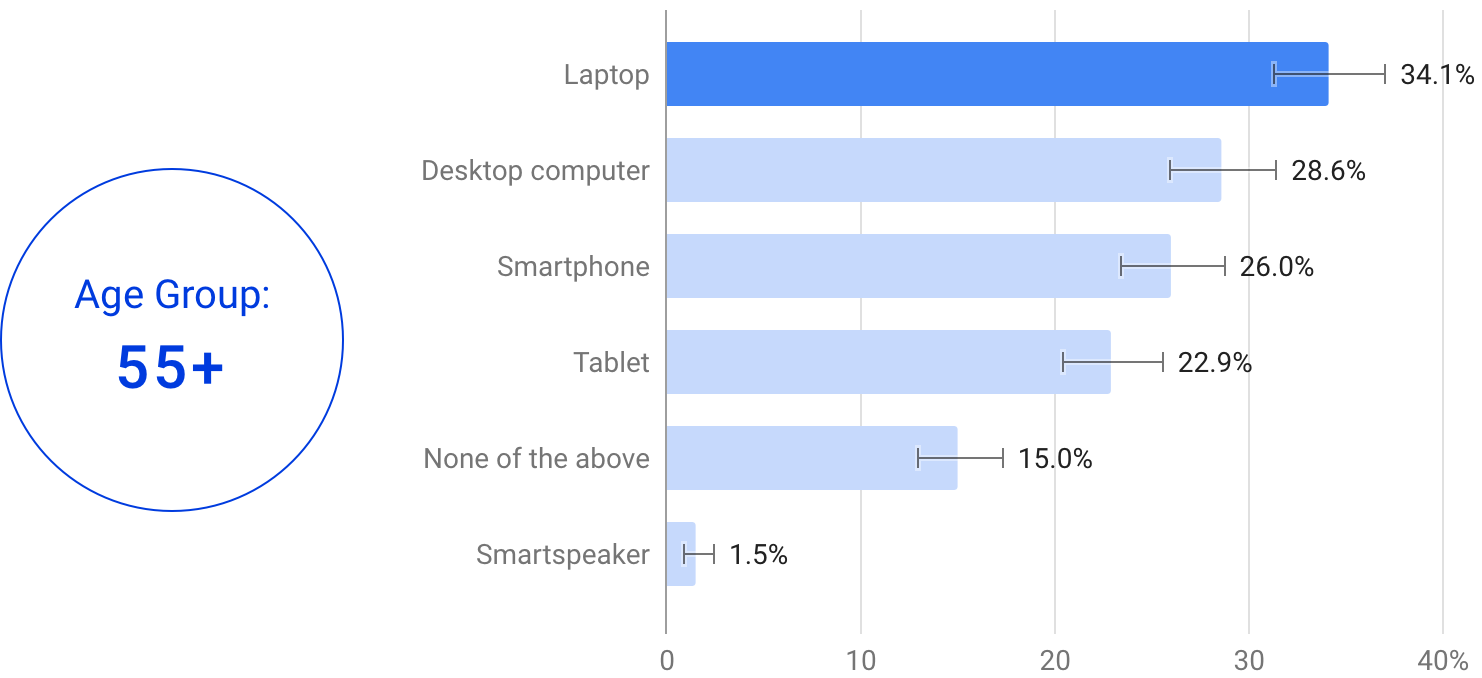
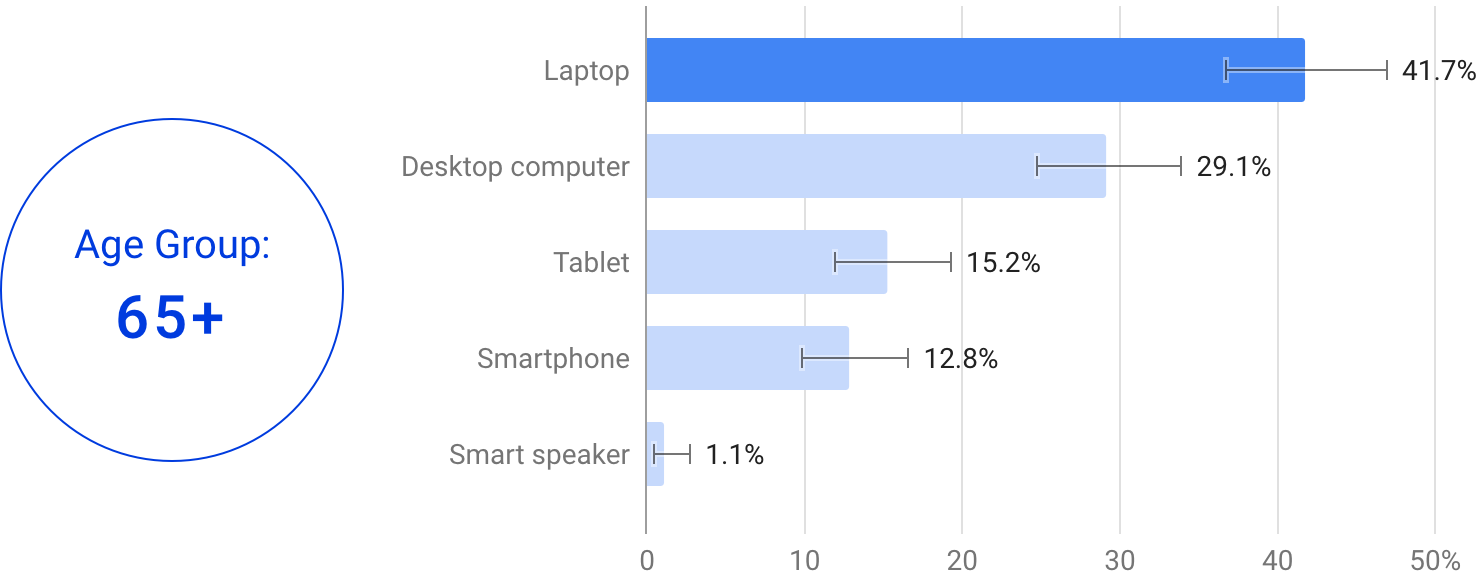
Age demographic results for 55 + years
- Over 60% of those over 55 conduct online research with a laptop or desktop.
Age-related key statistics:
- 48% of consumers aged 18-44 use smartphones when conducting online research.
- Laptops are the most preferred research tool for consumers over 55.
- Tablets are utilized nearly twice as often among consumers over 55 (23%) compared to those 54 and under (12%).
- Only 18% of respondents 18-44 said they use desktop computers to conduct online research.
- Adults aged 18-44 are more likely to integrate smartphones into their research process.
- 26% of those aged 55+ said they use a smartphone for research, and nearly 23% use a tablet
Digging further into the demographic data shows the influence of smartphones and tablets across the generational divide. With only 18% of those aged 18-44 using desktop computers and even fewer(12%) using tablets, the bias toward pocket-sized digital accessibility highlights a key shift in young and middle-aged adults’ shopping habits. Looking at an older cohort, laptops and desktop computers are still the choice devices when conducting research online.
2. Where do you search online when researching a product?
Key statistics:
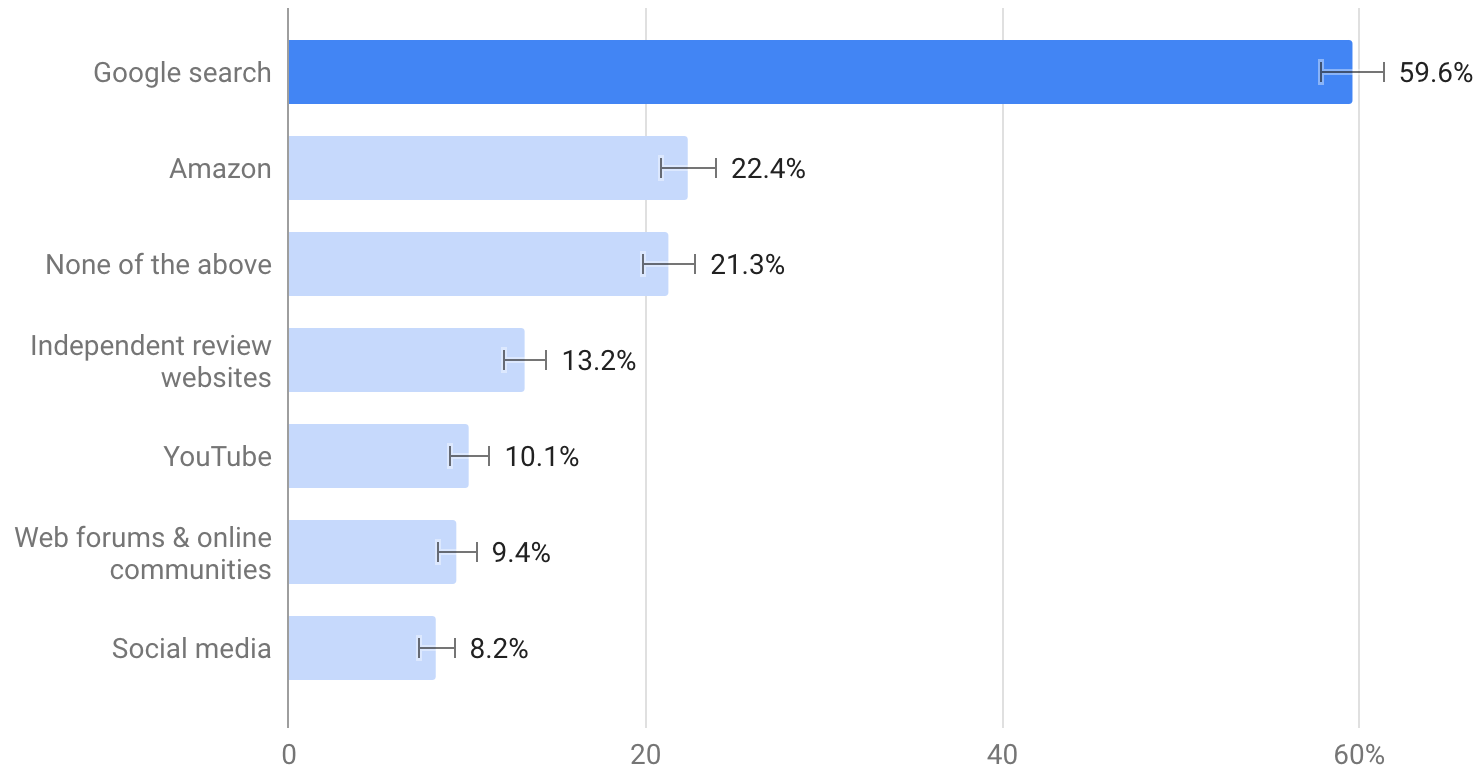
- Nearly 60% of consumers use Google when researching a product online.
- 22% of respondents said they search Amazon when conducting product-based research.
- 82% of consumers said they used Amazon or Google when researching a product.
- Only 8.2% of consumers use social media when researching a product online.
- Consumers utilize more than one platform when conducting online research.
This multiple answer question saw 44% more answers than respondents. The high number of responses around search engines, specifically Google, indicates their position as a major component in online research trends. Search engines are a likely starting point for most users before continuing to Amazon, YouTube, or various review sites and online community forums. However, Google and Amazon collectively captured 82% of consumer responses. It’s a safe bet to say that search engine optimization on both platforms is massively important to product discovery and online sales. While it may increase brand awareness, consumers don’t seem to rely on social media when conducting product research.
3. When purchasing a product online, what payment method do you most prefer?
Key Statistics:
- Nearly 1 in 2 shoppers (45%) prefer to use credit cards when purchasing a product online.
- 71% of consumers prefer to use credit or debit cards when making online purchases.
- Only 2.5% of consumers prefer to use ACH as a form of online payment.
- Consumers prefer to utilize Paypal or Stripe (21%) nearly five times more than Apple Pay (4%) or Amazon Pay (4%)
- 21% of consumers utilize Paypal or Stripe when making an online purchase, while 8% prefer Apple Pay and Amazon Pay.
Consumers still prefer to purchase with credit cards, which are more popular than nearly all other payment methods combined. Going beyond credit cards, the popularity of card-based transactions continues to dominate the market. When combined with debit cards, card-based transactions capture 71% of the market. While alternative online payment methods like PayPal and Stripe are preferred by nearly 21% of consumers, these payment methods are more likely to be unavailable. The same is true for Amazon Pay, Apple Pay, and other digital wallets. For online merchants, accepting transactions from traditional merchant vendors like Visa and MasterCard to newer digital payment forms is necessary to cover the market.
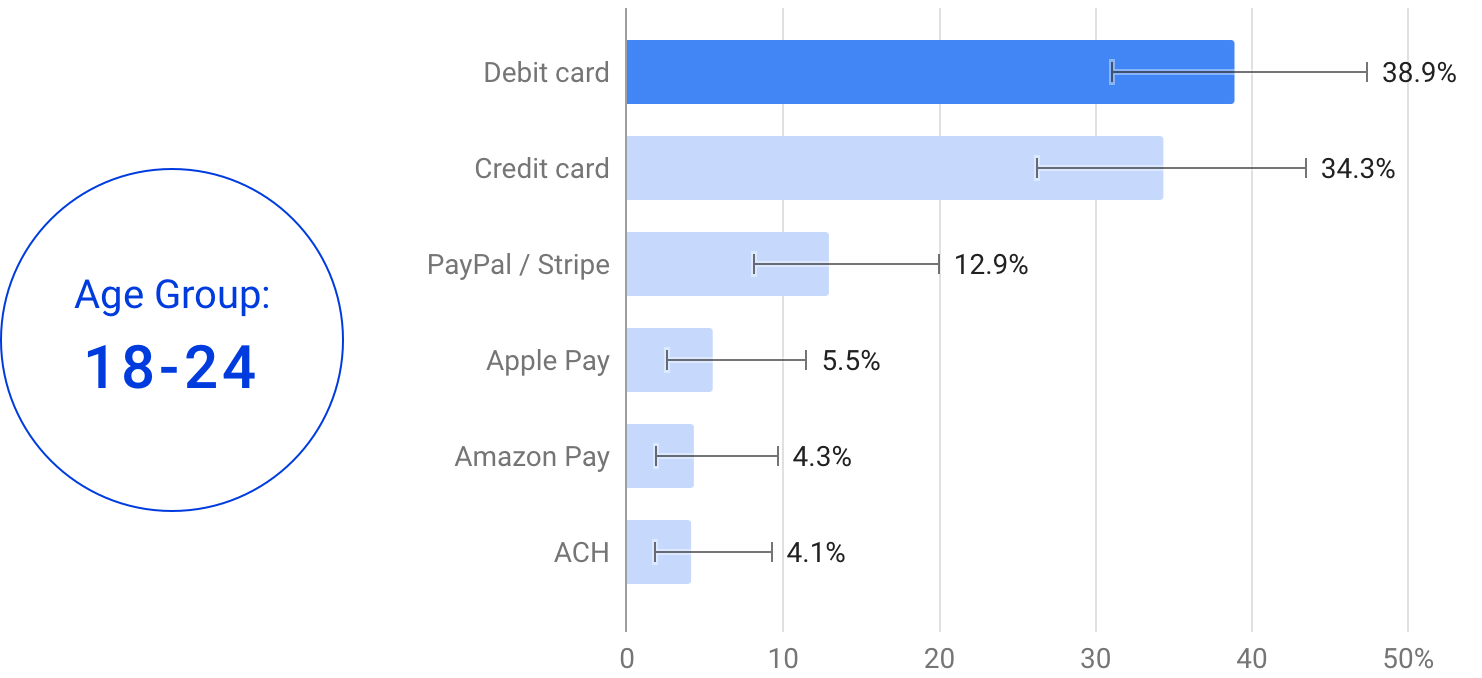
Results from 18-24-year-olds
- 38.9% of this age group prefers to shop online with a debit card.
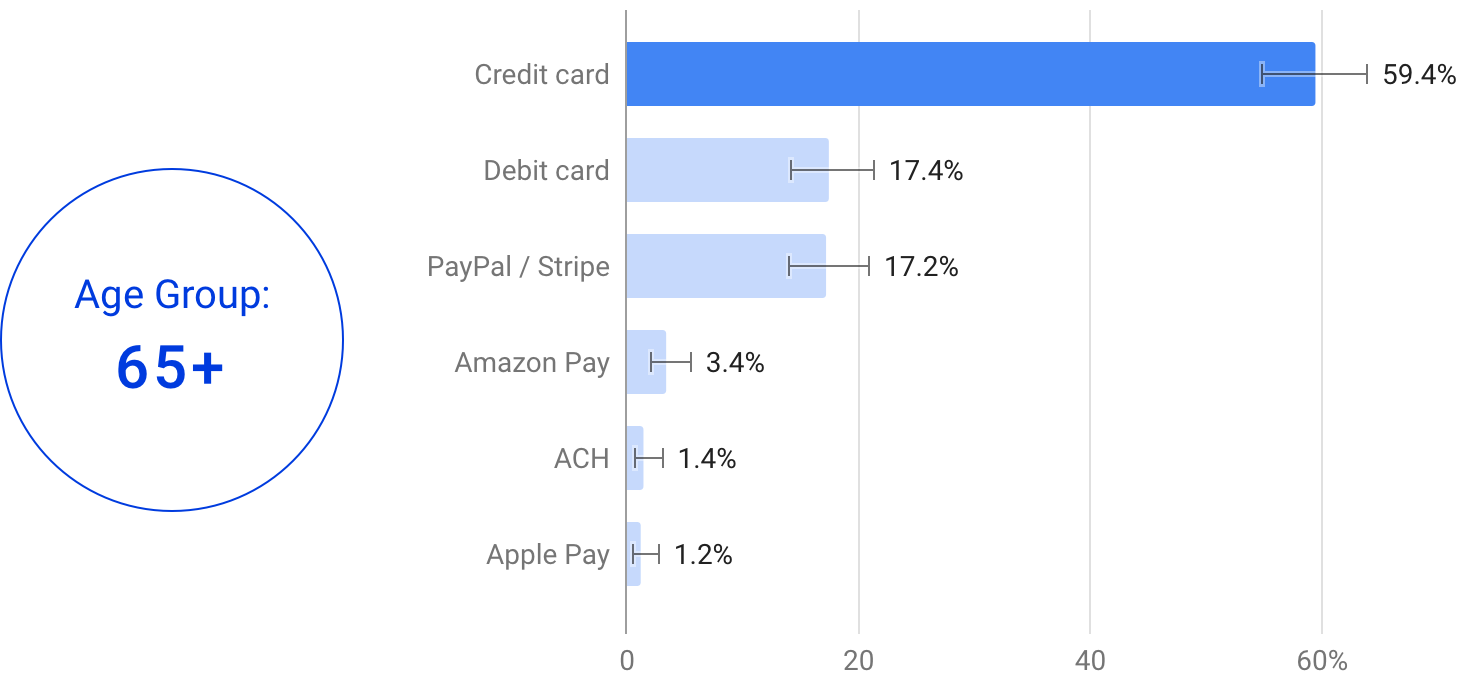
 Results for the age group 65+
- 59.4% of this age group prefers to shop online with a credit card.
Key Statistics:
- 40% of consumers aged 18-24 prefer to use debit cards, compared with 18% of consumers 65 and older.
- While only 42% of consumers aged 25-34 prefer credit, that number climbs significantly in the 65+ crowd to nearly 60%.
- Generation Z prefers debit cards over credit cards as their most preferred method of payment online.
- Those aged 65+ overwhelmingly prefer credit cards as their preferred method of payment online.
While many preferences were similar across all age groups, older consumers clearly favor credit cards over alternative payment methods. On the other hand, respondents aged 18-24 prefer debit cards to credit cards. Considering that credit must be established and then built upon, the 18-24 cohort may find themselves limited in credit use and availability, deferring to a debit card until they’re better established in the market. Younger demographics may also be more inclined to use newer alternative forms of payment options available in today’s market, options that may not have been around when older consumers were making choices around how to spend their money.
4. When making online purchases, what device do you most often use?
Key Statistics:
- Smartphones are the device most often used when making online purchases.
- 75% of online purchases are made with portable devices, like smartphones, tablets, and laptops.
- 32% of consumers prefer to purchase laptops, compared to 22% on desktops.
- 11% of respondents make online purchases with tablets.
It’s impossible to discount the rise of mobile devices and their impact on consumer purchasing habits. In the US and across the globe, mobile devices are often used to access the Internet more than desktop computers. Our data show similar results for online purchases. When buying online, consumers are most likely to do so on a device they can carry on their person. Whether this comes down to impulse purchasing or casual browsing habits while away from an office setup, 3 out of 4 online purchases are generated from portable devices. Unlike desktops, this range of mobile devices fluctuates wildly in size and on-screen real estate. This may present new challenges to business owners in the e-commerce field who have yet to implement responsive design to answer mobile browsing habits. However, this is a key factor for businesses to consider. With so many screen shapes and sizes, adaptable interfaces are a key component in online transactions.
Results for those over 65
- For consumers 65+, laptops are the preferred device for online transactions.
While the raw data highlights smartphones as a majority device, a demographic analysis reveals that it’s a generationally-weighted tool, with consumers aged 25-34 far more preferential to smartphones than their elders. The preference for smartphones decreases with age, with each cohort showing a preference for larger screens as they get older, perhaps due to biological changes and failing eyesight. Notably, tablets aren’t a primary purchasing device, even among older cohorts. Instead, laptops and smartphones vie for the top spot across every generational divide.
5. When purchasing a product online, what is the biggest reason for using a particular payment method?
Key Statistics
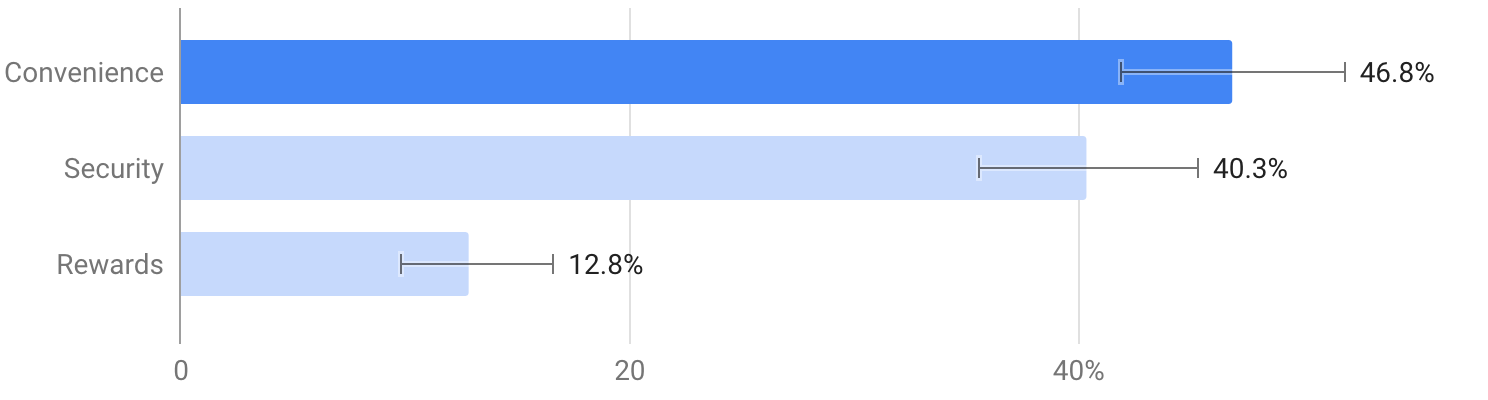
- 47% of consumers cite convenience as their primary reason for using a particular online purchasing method.
- 4 in 10 respondents say security is their biggest reason for using a particular payment method to purchase products online.
- 13% of buyers view rewards as a primary reason for using a particular payment method.
Consumers prefer fast and easy checkouts to additional security measures or incentivized rewards when making purchases online. It’s reasonable to conclude that while something may be a primary reason, consumers wholly disregard the other options. The same may be said for online purchasing habits. In a recent Experian survey, consumers point out that security, while important, shouldn’t slow down a website or impair the user experience. Website purchasing experiences can vary wildly, and many convenient forms of payment have some security measures baked in. However, if push comes to shove, consumers trend toward ease of use. E-commerce operators should do their best to ensure that their checkout experience is fast and easy while offering various preferred payment methods during the transaction process. Methodology: We surveyed 2387 people via an online publishing network in the United States. All gender and all ages are represented. Thank you for reviewing our Buyer Behavior Survey!
Further reading: the FTC’s online shopping guidance covers consumer protections that pair with these statistics.